This was my 2008 senior honors thesis at the University of Mississippi, and was based on research I did in the biological engineering laboratory of Dr. Peter C. Dedon at MIT. Download a PDF copy here.
Dedication
This thesis is dedicated to my uncle, Robert "Buddy" Allen, Jr. His infectious curiosity and unwavering encouragement have helped make me the scientist I am today.
Acknowledgements
This thesis could not have been completed without the help of so many people. I thank my advisor and mentor, Dr. Daniell Mattern, for turning my vague curiosity about organic chemistry into a profound fascination with and love for the subject. I thank my mentor, Dr. Walter Cleland, Jr., for years of personal and professional instruction, motivation, and advice. I thank my readers, Drs. Susan Pedigo and Tristan Denley, for their watchful eyes and their constructive criticism. Finally, I thank the faculty and staff of the Sally McDonnell Barksdale Honors College for providing me with countless opportunities for academic and personal growth.
Abstract
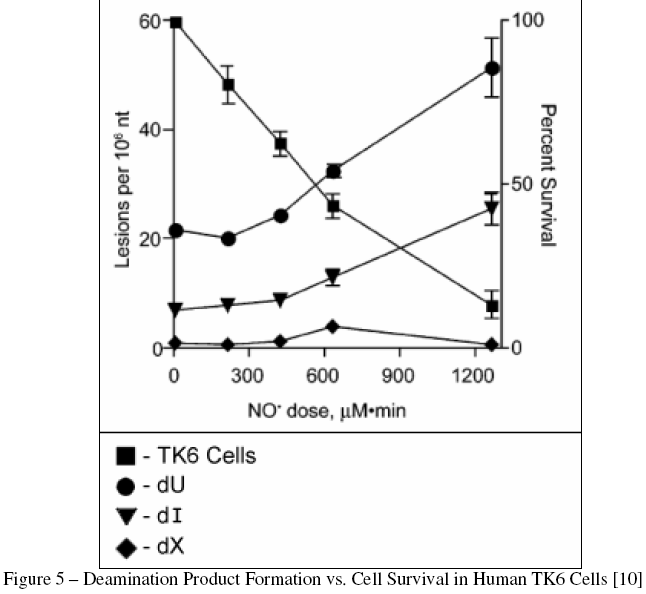
Nitric oxide (NO) is an essential biological molecule that is a suspected mediator in the development of various diseases that are associated with chronic inflammation, including cancer. Attempts to study the in vivo effects of NO on biological systems have been hampered by numerous methodological problems, but the advent of an easy to fabricate, controllable membrane diffusion delivery system that avoids gas-phase NO chemistry and approximates the conditions at sites of inflammation has solved many of these. Dong and Dedon used the original system to define cytotoxicity and nucleobase deamination in human lymphoblastoid TK6 cells. They found that steady-state concentrations of 1.75 μM NO up to a total dose of 1230 μM*min resulted in modest formation of the deamination products deoxyxanthosine (dX, nearly undetectable), deoxyinosine (dI, ~20 lesions per 10^6 nucleotides), and deoxyuridine (dU, ~55 lesions per 10^6 nucleotides) only after exposure to relatively toxic doses of NO. Using a recently fabricated copy of the system, this project verified the system's reproducibility and used it to study the more robust human colon carcinoma HCT116 cell line. Delivery of a steady-state concentration of 6.94 μM NO up to a total dose of 2500 μM*min resulted in the same undetectable formation of dX and significantly decreased formation of dI (~0.5 lesions per 10^6 nucleotides) and dU (~7.0 lesions per 10^6 nucleotides).
List of Abbreviations
- dI: deoxyinosine
- dU: deoxyuridine
- dX: deoxyxanthosine
- DFX: desferrioxamine
- HCT116: human colon carcinoma cell line
- HPLC: high performance liquid chromatography
- MPO: myeloperoxidase
- NO: nitric oxide
- NOS: nitric oxide synthase
- ONOO-: peroxynitrite
- ONOOCO2-: nitrosoperoxycarbonate
- PBS: phosphate buffered saline
- RCF: relative centrifugal force
- RNS: reactive nitrogen species
- ROS: reactive oxygen species
- SOD: superoxide dismutase
- THU: tetrahydrouridine
- TK6: human lymphoblastoid cell line
Chapter 1: Nitric Oxide Chemistry & Biochemistry
Nitric oxide (NO) is a naturally occurring, gaseous molecule with an acrid, penetrating odor. It has eleven valence electrons, which gives it a bond order of 2.5 and makes it a free radical, meaning that it has a single unpaired electron in its valence shell. This unpaired electron makes NO highly reactive, and it will readily combine with a number of molecules to form more stable molecules with full valence shells. Despite this reactivity, NO is a fascinating molecule with myriad functions and effects in the human body. A complete summary of its chemistry and biochemistry is beyond the scope of this project, but is available in several reviews from which the following brief outline was constructed [1-8]. NO is produced in vivo by three types of nitric oxide synthase (NOS), which - in the presence of molecular oxygen and several cofactors - oxidize the guanidino nitrogen of L-arginine to form NO [4]. Endothelial NOS (eNOS) and neuronal NOS (nNOS) are both constitutive enzymes, showing rapid Ca2+/calmodulin-dependent activation and producing nanomolar amounts of NO. At such low concentrations, NO has a relatively long half-life and functions primarily as a vasodilator (in the case of eNOS) or a neurotransmitter (in the case of nNOS) [8].
Inducible NOS (iNOS) is, as the name implies, the inducible form of the enzyme, and is found in macrophages. There it is responsible for the release of NO as a cytotoxic agent as part of the nonspecific immune system's inflammatory response [5]. In addition to NO, this inflammatory response results in the release of a variety of other biomolecules, including hydrogen peroxide, superoxide ion, and nitrate ion. Nitric oxide can readily combine with these molecules to produce a variety of reactive nitrogen species (RNS) and reactive oxygen species (ROS), as shown in Figure 1 [16].
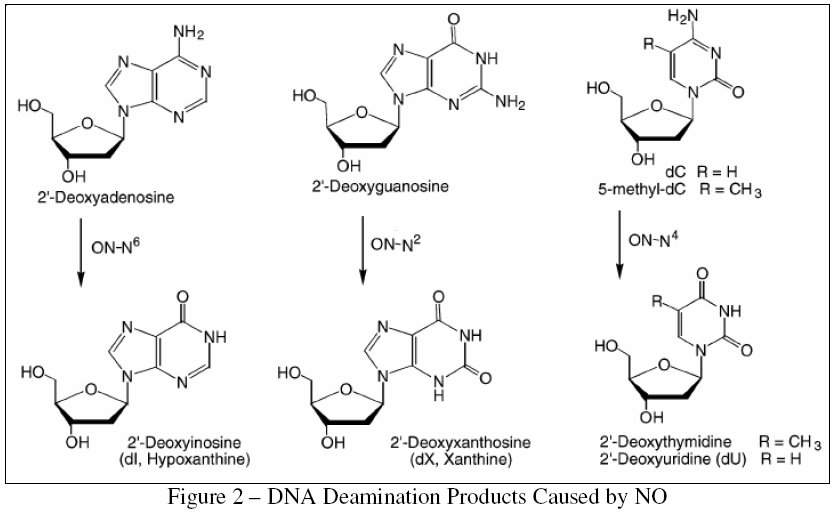
In contrast with the nanomolar amounts of NO generated by the constitutive enzymes, iNOS can produce NO at levels of up to 4x10^6 molecules/cell [7], which can result in steady-state NO concentrations of up to 1 μM in chronically inflamed tissues [10]. When such inflammation continues for periods of months or years, significant quantities of NO and derived RNS and ROS can develop in neighboring healthy tissues. These species, in turn, are known to cause a variety of DNA lesions, most notably the nucleobase deamination products shown in Figure 2, which result from the conversion of an amino group into a carbonyl group. Such lesions often result in detrimental DNA lesions by producing high levels of G:C to A:T point mutations [12].
Chronic inflammatory conditions such as gastritis, hepatitis, and colitis are a recognized risk factor for a variety of human cancers, and DNA damage by RNS and ROS has been implicated as the causal link between these conditions and cancer [8]. NO is intimately involved in the production of these chemicals, so understanding its in vivo reactions and mechanisms is a major focus of modern cancer biology.
Chapter 2: Comparison of Nitric Oxide Delivery Systems & Foundation Studies
Given its close association with the development of a variety of human cancers, it is not surprising that NO biochemistry has been a major area of research in recent years. A number of methods have been developed for delivering NO to cultured cells. Three of the most common of these are: use of NO donor compounds (such as so-called "NONOates"); addition of NO-saturated aqueous solutions; and co-culture with NO-generating cells, such as macrophages [9]. Unfortunately, all of these methods possess significant limitations that hinder their direct application to biological systems. Donor compounds generally do not produce constant levels of NO, and their addition to cell cultures can have unforeseen biological consequences [14]. Likewise, co-culture systems alter the biochemical environment of the experiment and make it impossible to isolate the activity of NO [15]. Saturated aqueous solutions allow for NO to reach the gas phase, which contributes anomalous gas-phase kinetics and reactivity that are irrelevant to biological systems, where NO can exist only as an aqueous solution [9]. Additionally, none of these methods accounts for the depletion of molecular oxygen (O2) from the cellular environment through the course of the experiment [10]. As seen before in Figure 1, O2 is necessary for the formation of RNS and ROS, so its concentration must be controlled in order for studies to be physiologically relevant. Finally, all of these methods lack the degree of control necessary to generate steady-state NO concentrations that mimic those found in biological systems, and result in NO concentrations that are several orders of magnitude above physiological relevance [10].
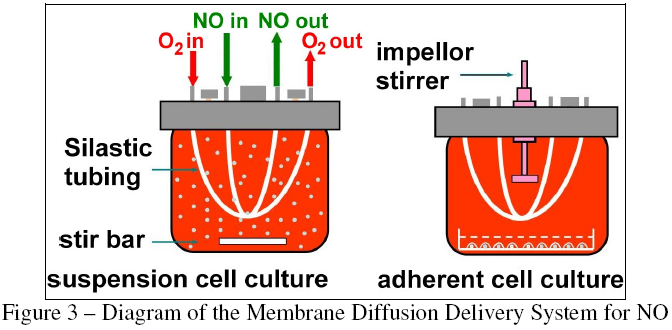
In order to solve these problems, researchers at the Massachusetts Institute of Technology developed the nitric oxide delivery system shown in Figure 3 [9]. The system utilizes two segments of gas-permeable polydimethylsiloxane (Silastic) tubing to deliver constant levels of both O2 and NO to the cell culture medium, overcoming the problem of O2 depletion during exposure. The presence of inlet and outlet ports on the top of the delivery vessel allows for it to be completely filled with liquid, eliminating any air bubbles and avoiding gas-phase NO chemistry. The steady-state concentrations of both NO and O2 can be controlled with great precision by modifying any combination of three parameters: composition of the delivered gas; flow rate of the delivered gas; and length of the tubing segments. This level of control allows for the study of NO at physiologically relevant concentrations.
The delivery system was intended to be copied and utilized by other researchers, so it was designed to be compact, inexpensive to acquire, and simple to fabricate. In addition, a substantial amount of mathematical modeling was completed and published for the system so that the controllability of any newly fabricated copy could be experimentally validated. The result is shown in Figure 4. The original system was fabricated in the laboratory of Dr. Gerald Wogan, and was subsequently used by both the Wogan group and the group of Dr. Peter Dedon to investigate the effects of NO on human cell lines.
Dong and Dedon performed the first rigorous, quantitative examination of the effects of longterm cellular exposure to physiologically relevant levels of NO, using the membrane delivery system to study the well-characterized TK6 cell line. Cells at a density of 5x10^5 cells/mL were suspended in 115 mL of RPMI 1640 medium and exposed to 10%:90% NO:Ar through 7 cm of Silastic tubing (NO steady-state concentration in bulk medium of 1.75 μM) and 50%:5%:45% O2:CO2:N2 through 4 cm of tubing (O2 steady-state concentration in bulk medium of 186 μM) for 2, 4, 6, and 12 hours (cumulative NO doses of 210, 420, 650, and 1230 μM*min, respectively). Following exposure, cell survival was analyzed and nucelobase deamination products were quantified. The result, shown in Figure 5, was that the formation of DNA lesions did not significantly increase until a relatively toxic dose of NO had been delivered (cell survival was ~50% when the most common lesion, dU, began to increase sharply) [10]. Additionally, the total level of each deamination product was 2-3 times lower than what had previously been found in studies of isolated DNA at in vivo concentrations exposed to similar doses of NO [11].
These results raised interesting questions and possibilities about the link between cytotoxicity and DNA lesion formation, such as whether lesion formation is a factor in inducing cytotoxicity, or if the cytotoxic mechanism is already largely engaged by the time lesions begin to form. Regarding the decreased lesion formation as compared to isolated DNA, Dong and Dedon offered two possible explanations. The first was that the biochemical environment of the cell, including the presence of various nucleophilic and reducing species, limited the access of NO and derived RNS and ROS to the nucleus. The second was that the rate of lesion formation was balanced by the rate of DNA repair in whole cells, meaning that as many lesions were formed as in isolated DNA, but many of them were repaired before they could be detected [10]. An additional possibility is that the high sensitivity of TK6 cells to NO-induced cytotoxicity caused the bulk of them to die before significant quantities of RNS and ROS could build up in the nucleus. Investigating and deciding between these possibilities was the primary goal of this study.
Chapter 3: Testing & Validating a Newly Fabricated Nitric Oxide Delivery System
As we have seen, early quantitative studies on the effect of NO on human cells produced strange results without clear interpretations. Toward the goal of clarifying the link between cytotoxicity and DNA lesion formation, this project paralleling the work of Dong and Dedon was carried out using the recently fabricated Dedon Laboratory delivery system. This was the first system constructed outside the Wogan Lab, and this study was the first time that it would be used to collect data. Therefore, the first aim of this study was to test and validate the Dedon Laboratory delivery system to ensure that it performed according to the published mathematical models.
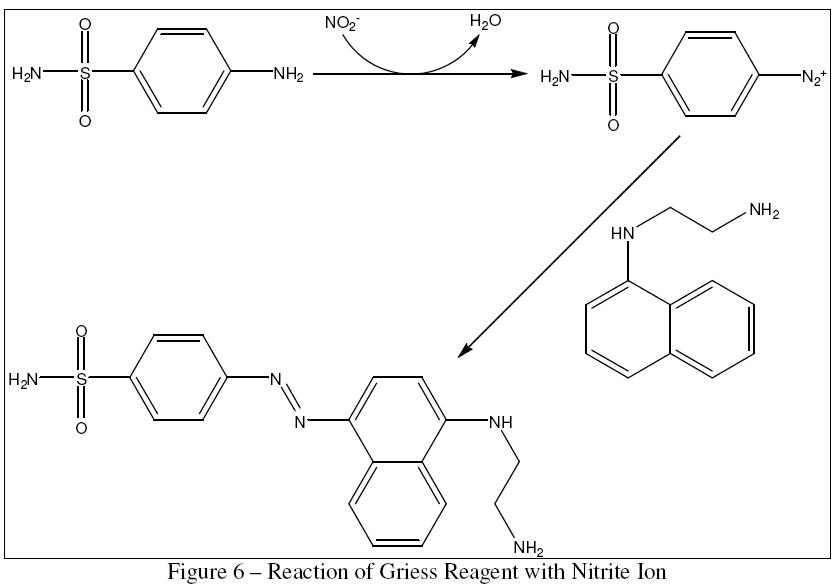
Keeping in mind the intent for the delivery system to become widely adopted, the validation method would have to relatively simple, quick, and inexpensive. The transient nature of NO makes it difficult to measure its instantaneous concentration without sophisticated electrochemical equipment that may not be readily available. However, in a standard oxygen atmosphere without high concentrations of RNS and ROS to combine with, NO has a single, stable downstream oxidation product, the nitrite ion. Nitrite ion concentration, in turn, is easy to determine spectrophotometrically using the well-known Griess reagent protocol [13], in which N-1-naphthylethylenediamine dihydrochloride and sulfanilamide combine in the presence of nitrite ion to produce a colored azo compound, as shown in Figure 6.
The validation was carried out using the same conditions as specified in the original system's mathematical modeling experiments [9]. Four vessels were loaded with two 7 cm segments of Silastic tubing, capped lightly, and autoclaved for 20 min. Vessels were filled with 115 mL sterile PBS and sealed, placed in the water bath at 37 ° C, and connected to 1%:99% NO:Ar and 50%:5%:45% O2:CO2:N2. Each vessel was fitted with an empty 1 mL collection syringe and a 10 mL replacement syringe filled with sterile PBS. NO was delivered for 4 hours with 1 mL samples taken and replaced every 30 min.
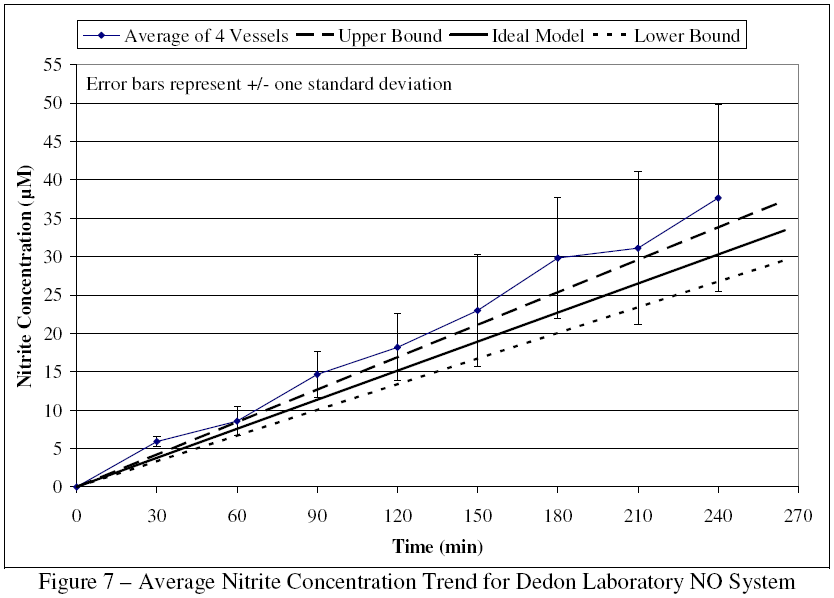
Samples were arranged in duplicate on a 96-well plate along with standard dilutions of nitrite in PBS with concentrations ranging from 0 μM to 55 μM. After addition of the Griess reagent, the plate was analyzed by ultraviolet-visible (UV-vis) spectrophotometry at 540 nm. The average concentration vs. time relationship for the four reactors compared to the mathematically modeled concentrations (based on unpublished work by Deen et al.) is shown in Figure 7.
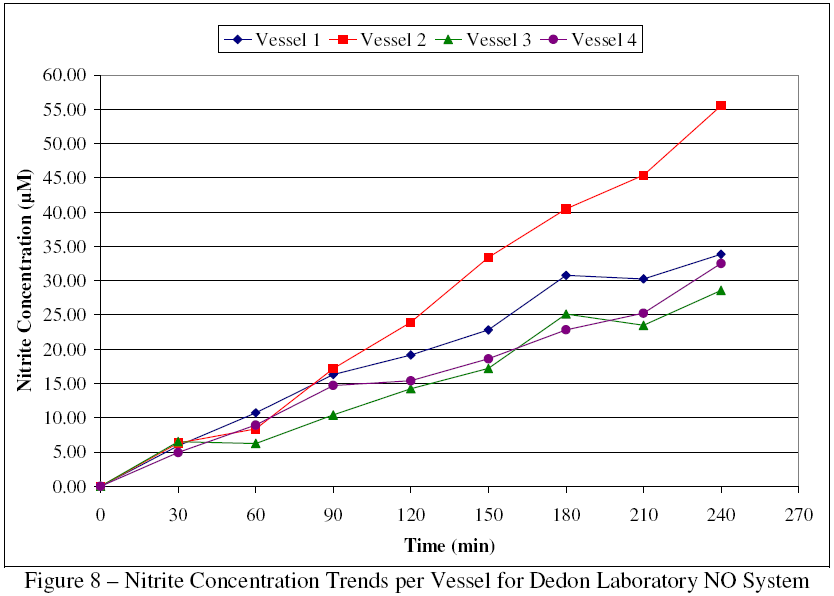
All but one of the concentration points fall within one standard deviation of the mean predicted concentration. However, the later time points show sizable standard deviations and concentrations that are appreciably above the upper model. Examination of the concentration trends per vessel, as seen in Figure 8, reveals that vessel 2 produced concentrations substantially above the average and was the main contributor to the poor precision. Based on this data, vessel 2 was examined and found to have a small leak in one access port. The port was retrofitted and the leak eliminated, so the Dedon Laboratory system could now be used to expand upon Dong and Dedon's earlier work.
Chapter 4: Effects of Nitric Oxide on Human HCT116 Cells
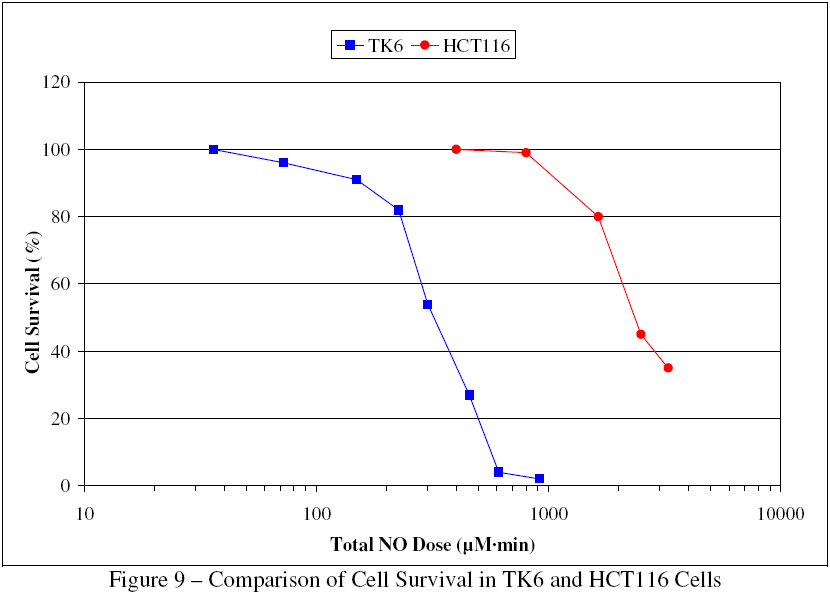
A major goal of this study was to go beyond the conclusions that could be drawn from the earlier study of TK6 cells, which were chosen for their well-characterized nature, rather than their relevance to inflammation-linked cancers. Therefore, this experiment utilized human colon carcinoma HCT116 cells, which come from a tissue that is known to experience increased cancer risk from inflammation (as seen in gastritis, irritable bowel syndrome, etc.). HCT116 cells are also roughly ten-fold more resistant to NO-induced cytotoxicity than TK6 cells, as seen in Figure 9. This increased robustness allowed for the use of both higher steady-state concentrations of NO and higher cumulative doses of NO, providing more information about the cytotoxic boundary concentrations. This study sought to define the steady-state levels of the DNA deamination products dX, dI, and dU in HCT116 cells exposed to toxic doses of nitric oxide, and compare those levels with cell survival data, with the ultimate goal of clarifying the link between cytotoxicity and DNA lesion formation.
HCT116 cell cultures were grown at 37 ° C in a humidified atmosphere of 95% air and 5% CO2, and were kept in McCoy's 5A Modified Medium supplemented with 10% heat-inactivated fetal bovine serum, 50,000 units of penicillin, 50 μg of streptomycin, and 5 mL of 200 mM Lglutamine. Cells were treated with hypoxanthine, aminopterin, and thymidine (HAT) to remove mutant cells, and stock plates were passaged on a routine schedule throughout experiments to maintain optimal cell density.
For cell survival measurements, HCT116 cells were plated at a density of 1x10^6 cells/plate in 2 mL of medium and 1 mL of trypsin-versene for a total volume of 3 mL/plate. Cells were incubated for 48 hours before exposure, achieving a final density of ~5x10^6 cells/plate. NO delivery vessels were prepared with 7 cm segments of Silastic tubing and were autoclaved for 20 min. Plates were then loaded into the vessels with 105 mL of fresh medium. Cells were exposed while stirring at 37 ° C to 100% NO and 50%:5%:45% O2:CO2:N2 using the membrane diffusion delivery system, as described in more detail before. Control cells for each time point were exposed to 100% Ar and the same O2:CO2:N2 mixture. Based on the mathematical models [9], the calculated steady-state concentrations in the bulk medium were 6.94 μM for NO and ~200 μM (near air saturation level) for O2. Based on earlier unpublished work by Li, exposure times of 1.5, 3, and 6 hours were chosen to correspond total NO doses below, at, and above the cytotoxic threshold, respectively. Each exposure was carried out in duplicate.
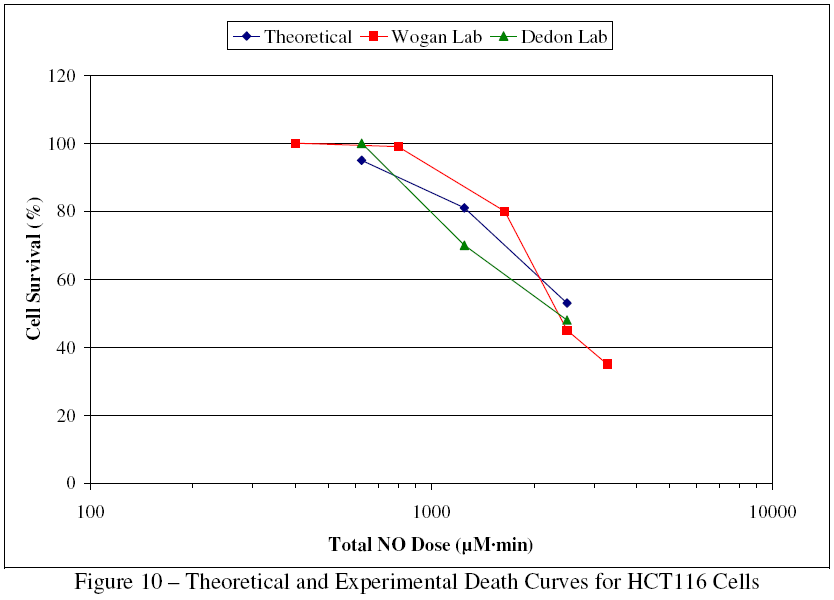
Immediately after exposure, cells were removed from the reactors and 3 mL of fresh medium was added to each plate. Cells were then incubated at 37 ° C for 24 hours, after which time cell survival was determined by trypan blue exclusion. Samples from each time point were mixed with a 0.4% trypan blue solution, and then the cells not taking up the dye were counted by visible light microscopy. Relative survival rates at each time point were determined by the ratio of live NO-exposed cells to live Ar-exposed cells, expressed as a percentage. Results are shown in Figure 10, with the mathematically predicted survival curve (based on unpublished work by Wogan et al.) and an unpublished curve by Li using the Wogan Laboratory delivery system shown for comparison.
For DNA lesion formation measurements, the same plating and exposure procedure was used with the following modifications. Control cells were exposed to 100% Ar and the same O2:CO2:N2 mixture for 6 hours, and each exposure was carried out in triplicate.
Immediately after exposure, cells were removed from the reactors and counted, then collected by centrifugation for 5 min at 700 RCF. Cell pellets were washed with PBS, flash frozen with liquid nitrogen, and stored at -80 ° C.
Genomic DNA was extracted from each sample using the Qiagen Genomic DNA Midi Kit with no deviations from the published protocol. The concentration of extracted DNA was measured by UV-visible spectroscopy at 260 nm and 280 nm (absorbance ratio), with the raw data shown in Table 1 below.
| Sample | A 260 nm | A 280 nm | Ratio | μg / μL | μg | μL / 50μg |
|---|---|---|---|---|---|---|
| 1.5 h NO 1 | 0.1013 | 0.0749 | 1.352470 | 0.05065 | 25.325 | 987.1668 |
| 1.5 h NO 2 | 0.1826 | 0.1067 | 1.711340 | 0.09130 | 45.650 | 547.6451 |
| 1.5 h NO 3 | 0.2405 | 0.1471 | 1.634942 | 0.12025 | 60.125 | 415.8004 |
| 3 h NO 1 | 0.1244 | 0.0733 | 1.697135 | 0.06220 | 31.100 | 803.8585 |
| 3 h NO 2 | 0.3029 | 0.1902 | 1.592534 | 0.15145 | 75.725 | 330.1420 |
| 3 h NO 3 | 0.2383 | 0.1416 | 1.682910 | 0.11915 | 59.575 | 419.6391 |
| 6 h NO 1 | 0.0076 | 0.0053 | 1.433962 | 0.00380 | 1.9000 | 13157.89 |
| 6 h NO 2 | 0.2616 | 0.1571 | 1.665181 | 0.13080 | 65.400 | 382.2630 |
| 6 h NO 3 | 0.1483 | 0.0868 | 1.708525 | 0.07415 | 37.075 | 674.3088 |
| Control 1 | 0.1796 | 0.1076 | 1.669145 | 0.08980 | 44.900 | 556.7929 |
| Control 2 | 0.3165 | 0.1900 | 1.665789 | 0.15825 | 79.125 | 315.9558 |
| Control 3 | 0.3094 | 0.1877 | 1.648375 | 0.15470 | 77.350 | 323.2062 |
A 50 μg aliquot was taken from each sample for digestion, purification, and quantification. Two samples - 1.5 h NO replicate #1 and 6 h NO replicate #1 - did not contain sufficient DNA to take aliquots, so they were skipped. Additionally, several samples contained less than 50 μg of total DNA, but still contained enough to attempt digestion and analysis, in which case the entire sample was used.
Samples were digested by first adding a mixture consisting of 30 μL of pH 6.8 sodium acetate buffer, 10 μL of zinc chloride, 4 μL of nuclease P1, and 2 μL of DNAse 1 to each sample. Internal standards for DNA deamination products were added to each sample, consisting of 0.5 μL each of 10 pM 15N labeled dI, dX, and dU. To prevent adventitious DNA lesion formation during digestion, a mixture of 1 μL of THU, 2 μL of coformycin, and 2 μL of DFX was also added to each sample. Samples were incubated for 3 hours at 37 °C, then a second digestion mixture consisting of 40 μL of pH 7.8 sodium acetate buffer, 2 μL of alkaline phosphatase, and 2 μL of phosphodiesterase as well as an additional 1 μL of coformycin was added to each sample. Samples were then incubated overnight at 37 °C.
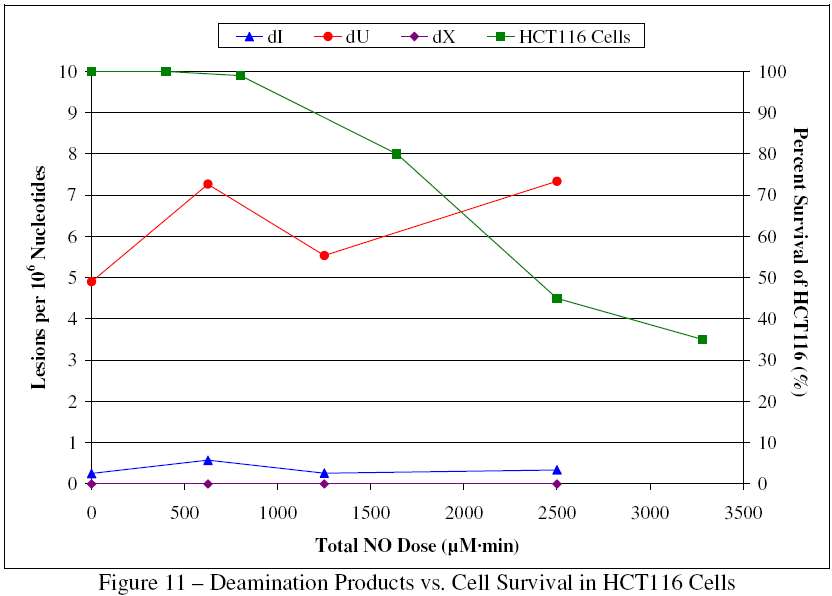
A standard mixture of dX, dI, and dU was run twice on reversed phase HPLC (ammonium acetate to acetonitrile) to calibrate the instrument and determine the time points for collecting each lesion fraction from digested DNA. Samples were then run and fractions containing isolated dX, dI, and dU were collected and quantified by a previously described LC/MS method [11]. Finally, lesion formation levels were plotted vs. total NO dose and overlayed with unpublished cell survival data by Li, as seen in Figure 11.
Despite being exposed to a four-fold higher steady-state concentration of NO (6.94 μM vs. 1.75 μM) and more than twice the cumulative dose of NO (2500 μM*min vs. 1230 μM*min), HCT116 cells showed one hundred-fold lower levels of dI and ten-fold lower levels of dU than did TK6 cells. This provides strong evidence that sensitivity to NO was not the cause of modest lesion formation in TK6, since exposure to a greater concentration of NO for a longer time period produced fewer lesions. Additionally, the small and relatively steady level of DNA lesions through the point of 50% cell death indicates that lesion formation is not the primary mechanism by which NO induces cytotoxicity.
These results are consistent with both of the two possibilities offered by Dong and Dedon for decreased lesion formation as compared to isolated DNA, but the "dynamic equilibrium"-type scenario in which the rate of lesion formation is balanced by an efficient rate of in vivo DNA repair is more consistent with the shape of the dU curve than simple exclusion of chemicals from the nucleus would be.
Chapter 5: Summary & Conclusions
The task of defining a specific cause-and-effect relationship in a dynamic biological system is necessarily difficult and lengthy. We have demonstrated the reproducibility and validity of a novel nitric oxide delivery system for cell culture studies, and have used that system to clarify the mechanism of NO-induced cytotoxicity and DNA lesion formation in HCT116 cells. We have shown that high sensitivity of a cell line to NO does not produce deceptively small amounts of DNA damage, and we have shown that DNA lesion formation is not the primary mechanism by which NO induces cytotoxicity. Finally, we have strengthened the argument that in vivo DNA repair is efficient enough to mitigate substantially NO-induced lesion formation. These findings provide another piece of the puzzle in our quest to understand the link between inflammation and cancer, which in turn will support our search for curative therapies.
Bibliography
- D.S. Bredt and S.H. Snyder. Nitric Oxide: A Physiologic Messenger Molecule. Annual Review of Biochemistry 1994; 63: 175-195.
- S.S. Gross and M.S. Wolin. Nitric Oxide: Pathophysiological Mechanisms. Annual Review of Physiology 1995; 57: 737-769.
- J.R. Lancaster Jr. Nitric Oxide in Cells. American Scientist 1992; 80: 248-259.
- J. MacMicking, Q. Xie, and C. Nathan. Nitric Oxide and Macrophage Function. Annual Review of Immunology 1997; 15: 323-350.
- S. Moncada, R.M.J. Palmer, and E.A. Higgs. Nitric Oxide: Physiology, Pathophysiology, and Pharmacology. Pharmacological Reviews 1991; 43: 109-142.
- C. Nathan. Nitric Oxide as a Secretory Product of Mammalian Cells. Federation of American Societies for Experimental Biology Journal 1992; 6: 3051-3064.
- R.S. Lewis, S. Tamir, S.R. Tannenbaum, and W.M. Deen. Kinetic Analysis of the Fate of Nitric Oxide Synthesized by Macrophages in vivo. Journal of Biological Chemistry 1995; 270: 29350-29355.
- P.C. Dedon and S.R. Tannenbaum. Reactive Nitrogen Species in the Chemical Biology of Inflammation. Archives of Biochemistry and Biophysics 2004; 423: 12-22.
- C. Wang and W.M. Deen. Nitric Oxide Delivery System for Cell Culture Studies. Annals of Biomedical Engineering 2003; 31(1): 65-79.
- M. Dong and P.C. Dedon. Relatively Small Increases in the Steady-State Levels of Nucleobase Deamination Products in DNA from Human TK6 Cells Exposed to Toxic Levels of Nitric Oxide. Chemical Research in Toxicology 2006; 19: 50-57.
- M. Dong, C. Wang, W.M. Deen, and P.C. Dedon. Absence of 2'-Deoxyoxanosine and Presence of Abasic Sites in DNA Exposed to Nitric Oxide at Controlled Physiological Concentrations. Chemical Research in Toxicology 2003; 16: 1044-1055.
- C. Coulondre, J.H. Miller, P.J. Farabaugh, and W. Gilbert. Molecular Basis of Base Substitution Hotspots in Escherichia coli. Nature 1978; 274: 775-780.
- L.C. Green, D.A. Wagner, J. Glogowski, P.L. Skipper, J.S. Wishnok, and S.R. Tannenbaum. Analysis of Nitrate, Nitrite, and [15N]Nitrate in Biological Fluids. Analytical Biochemistry 1982; 126(1): 131-138.
- L.K. Keefer, R.W. Nims, K.M. Davies, and D.A. Wink. "NONOates" (1-substituted diazen-1-ium-1,2-diolates) as Nitric Oxide Donors: Convenient Nitric Oxide Dosage Forms. Methods in Enzymology 1996; 268: 281-293.
- J.C. Zhuang, D. Lin, C. Lin, D. Jethwaney, and G.N. Wogan. Genotoxicity Associated with NO Production in Macrophages and Co-cultured Target Cells. Free Radical Biology and Medicine 2002; 33: 94-102.
- J. Dixon. Inflammation Chemistry. 2004. <http://www.jeffdixon.ca/>.